Asana acquires StackAI — now every human-agent workflow runs in one place.Learn more
Cost Benefit Analysis Template
Evaluate projects with a reusable template that helps you compare costs and benefits, apply key formulas, and make confident decisions before you commit resources.
Create your templateINTEGRATED FEATURES
Recommended apps

Summary
A cost-benefit analysis (CBA) helps you decide whether an idea is worth the time, money, and effort before you commit, by weighing expected costs against potential payoffs rather than relying on gut instinct. A cost-benefit analysis template gives you a practical way to evaluate a new project, idea, or strategy, so you can compare options, document assumptions, and explain your reasoning to others. In this article, you'll learn what a CBA template includes, when and how to use one, the key formulas behind every analysis, and the common mistakes that can throw off your results.
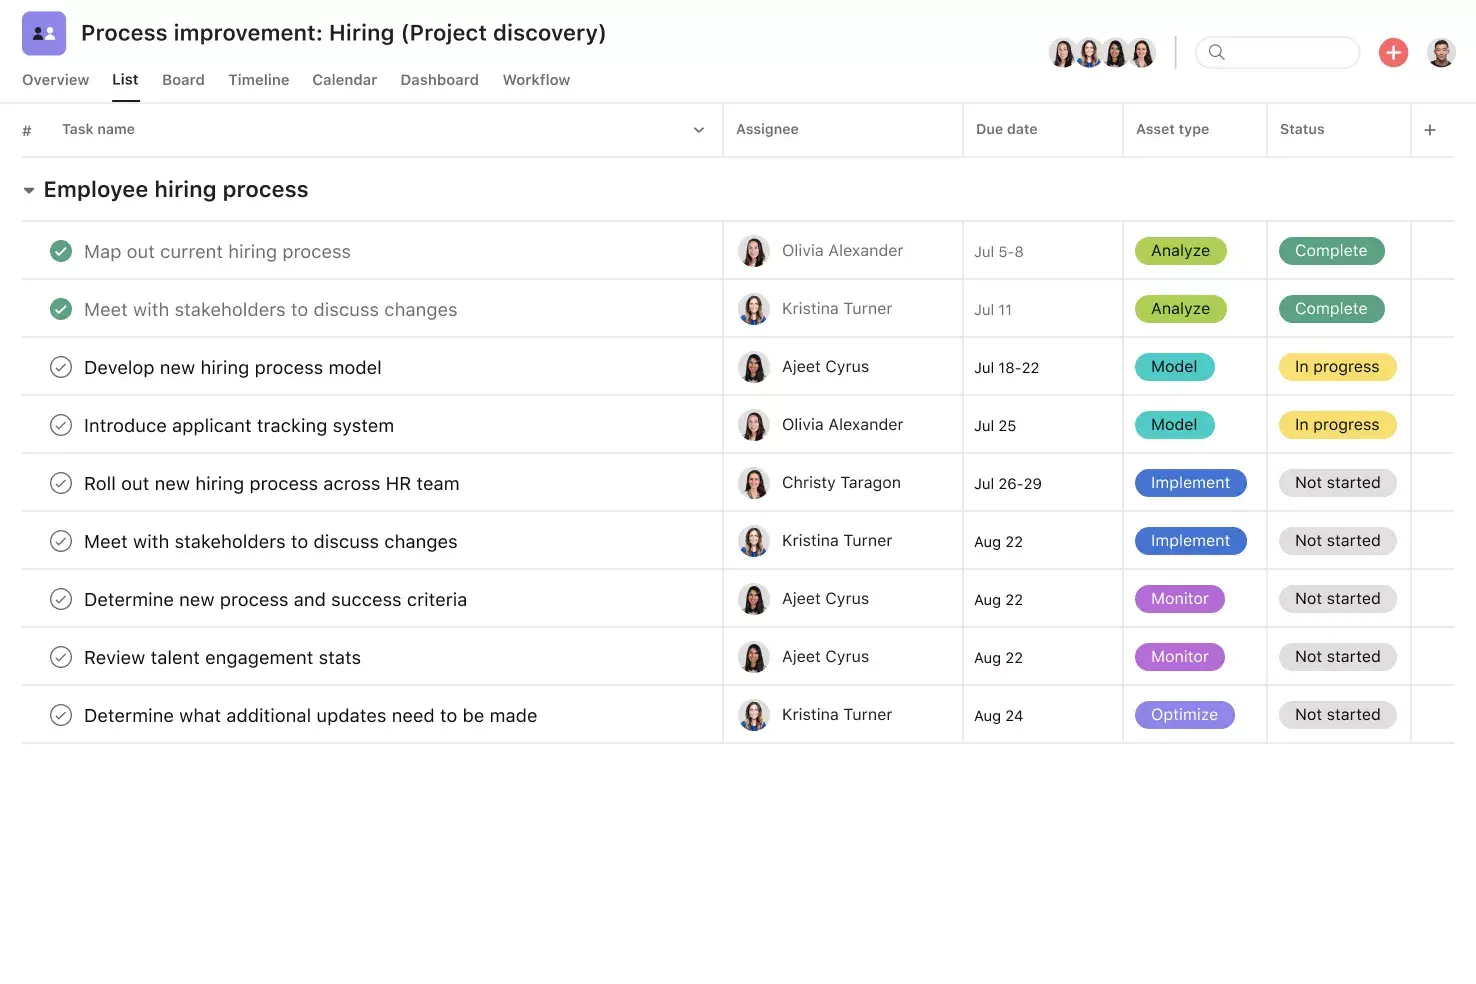
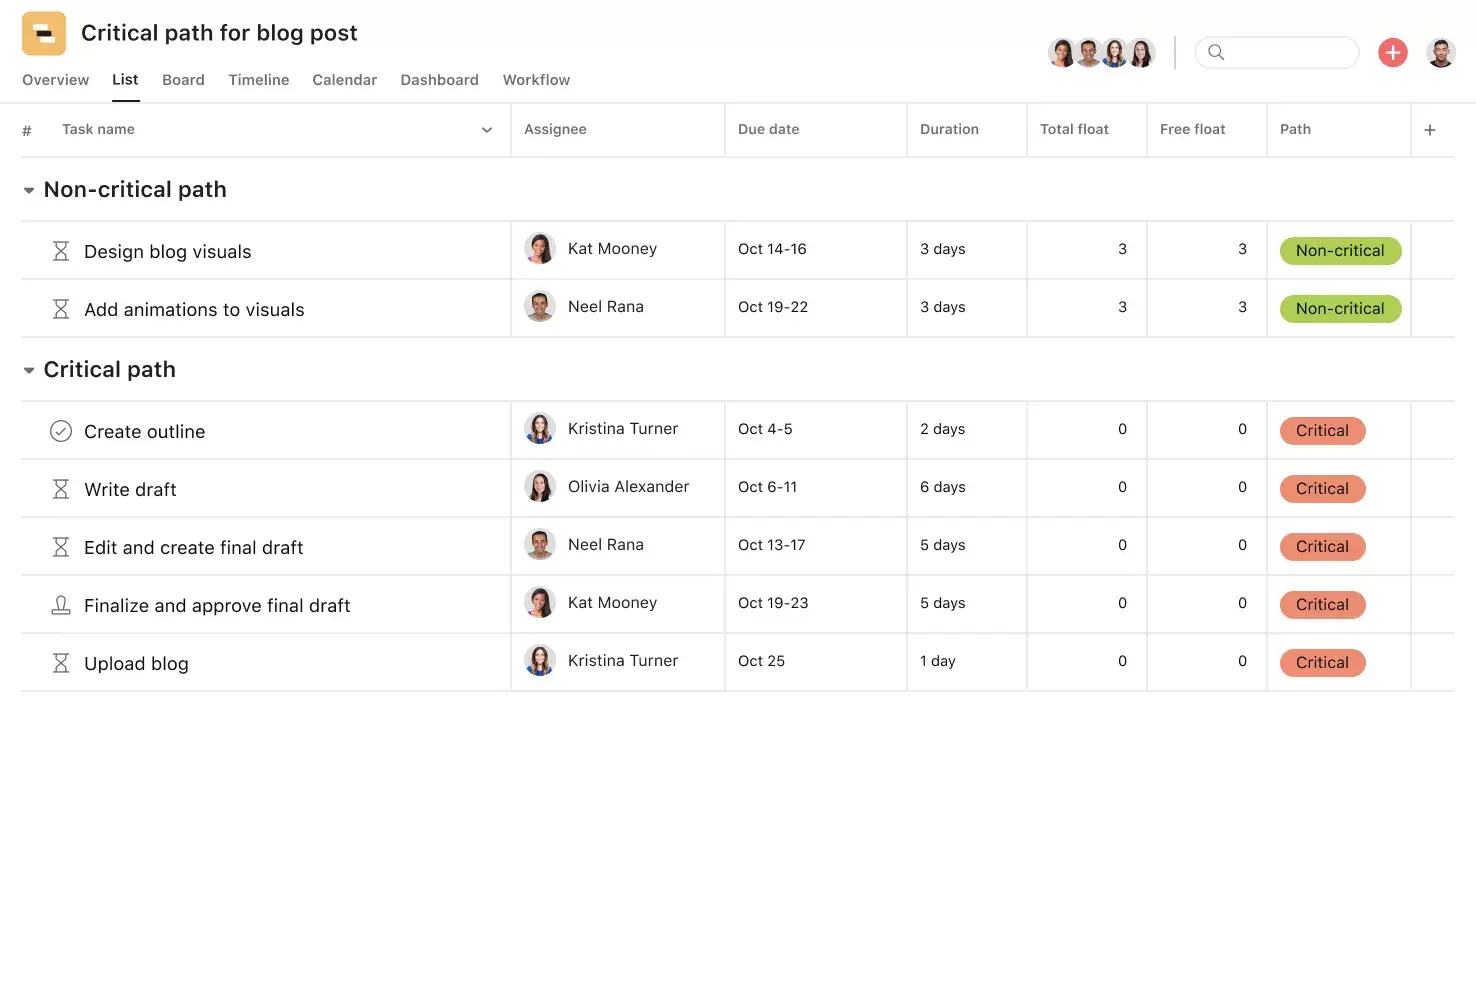
![[Product ui] Cost benefit analysis project in Asana, spreadsheet-style project view (List)](https://assets.asana.biz/transform/2cf2a9c8-8d86-4154-b6ab-1e7cff189bf5/TG23-web-hero-024-cost-benefit-analysis-static-2x?io=transform:fill,width:2560&format=webp)
What is a cost-benefit analysis template?
A cost-benefit analysis template is a reusable project-planning document that lists all expected costs and benefits of a decision, assigns values to each, and compares the totals to determine feasibility before committing resources. It helps you visualize total costs, including unexpected ones, relative to total benefits. Because the structure is already built, you can reuse it for every new project instead of rebuilding the analysis from scratch.
What are the benefits of using a cost-benefit analysis?
A cost-benefit analysis helps teams make decisions based on facts, not guesses. It gives you a clear way to compare options, which is especially helpful when the stakes are high or resources are limited. By listing costs, benefits, and risks together, teams can set priorities, explain trade-offs, and move forward with confidence.
The benefits of using a cost-benefit analysis include:
It helps teams evaluate new products, features, or strategies during early brainstorming.
It supports high-impact decisions tied to objectives and key results (OKRs) and key performance indicators (KPIs) by showing where effort delivers the most value.
It guides prioritization when time, budget, or staffing limits force hard choices.
It accounts for both financial and non-financial factors, including indirect or intangible costs.
It gives stakeholders a shared view of assumptions, calculations, and outcomes over time.
Tip: Use project management software like Asana to run your cost-benefit analysis in one place. Track costs, benefits, and assumptions by task, update values as inputs change, and share the analysis with stakeholders so everyone can review the exact numbers and decisions as they evolve.
When to use a cost-benefit analysis template
A cost-benefit analysis template is useful any time you need to justify a decision with data, but some situations call for it more than others. If you're weighing options that involve significant time, money, or team resources, a structured comparison helps you move forward with confidence rather than guesswork.
Common scenarios where a CBA template adds value:
Evaluating a new project or initiative. Before committing budget or headcount, use a CBA template to compare expected costs against anticipated benefits. This helps you and your stakeholders agree on whether the project is worth pursuing.
Comparing technology or software investments. When choosing between tools or platforms, a CBA template lets you map licensing fees, implementation effort, and training costs against the productivity gains and savings each option offers.
Assessing process improvements. If your team is considering automating a manual workflow or restructuring a recurring process, a CBA helps you quantify the effort involved and the time you'll save.
Prioritizing competing requests. When multiple projects compete for the same resources, a CBA template gives you a consistent way to rank options based on their net value rather than opinion alone.
Presenting a business case to leadership. A completed CBA provides the supporting evidence leaders need to approve or reject a proposal, as it clearly shows the expected return relative to the required investment.
If you’re not sure if a CBA is the right tool, ask yourself: "Am I deciding between options that have real costs and measurable benefits?" If yes, using a template can help you make your choice more clearly and efficiently.
How to use a cost-benefit analysis template
Use a cost-benefit analysis template to compare options before you commit resources. Start by defining the informed decision you need to make, then list all expected costs and benefits for each option. After that, assign values where possible, compare totals to determine which option yields the strongest return, and document your assumptions so others understand your conclusions.
Here's a simple cost-benefit analysis example:
Define the decision or option you want to evaluate. For example, you assess an automation initiative to decide whether the team should replace a manual reporting process.
List all costs, including time, money, and operational effort, as well as potential risks. Continuing our example, you would account for software fees, setup time, training effort, and opportunity costs related to delaying other work.
List all benefits, including revenue, savings, or strategic impact. You estimate cost savings based on fewer manual hours and faster turnaround times.
Assign monetary values or ranges to each item, then sum them. You assign values using standard metrics, such as hours saved per week and annual labor reductions.
Compare outcomes and record the rationale behind your choice. You calculate net benefits and review the expected return on investment to see whether gains outweigh costs.
Inputs vs. outputs
In a cost-benefit analysis: inputs = costs and outputs = benefits.
For your template, create a section for both inputs and outputs. To determine the total project cost, factor in direct costs and indirect costs, intangible benefits, and financial benefits, as well as associated risks. For example, if you're developing a new software program, you'd include the physical resources you need (computers and a team) as well as potential costs, such as increased Wi-Fi charges.
Other examples of inputs:
Salaries for new team members
Paid training or software
Manufacturing costs
Other examples of outputs:
Production increase of 10%
Higher customer satisfaction
Revenue growth
Some costs and benefits may not have a clear dollar amount. When this happens, try to estimate a dollar value. For example, higher customer satisfaction can lead to more sales, so you can estimate how much sales might increase over time if your new project improves customer satisfaction.
Read: Use a cost comparison template to make faster decisionsCost-benefit analysis formulas and calculations
After you list your costs and benefits, you’ll need a way to compare them with numbers. The formulas below help you turn your data into clear, comparable figures so you can see if a project makes financial sense.
Cost-benefit ratio (BCR): Compares benefits to costs. Use it for a quick viability check.
Net present value (NPV): Values future cash flows today. Use it to compare timelines.
Return on investment (ROI): Shows percentage return. Use it to communicate value.
Payback period: Shows the time to recover costs. Use it to gauge how fast you break even.
Cost-benefit ratio
The cost-benefit ratio (BCR) is the simplest way to compare total benefits to total costs. You calculate it by dividing the total expected benefits by the total expected costs:
BCR = Total benefits ÷ Total costs
A BCR greater than 1.0 means benefits outweigh costs, which signals a potentially worthwhile investment. For example, if a project's total benefits are $150,000 and total costs are $100,000, the BCR is 1.5, meaning you gain $1.50 for every $1 spent.
Net present value
Net present value (NPV) accounts for the time value of money, meaning a dollar today is worth more than a dollar a year from now. NPV discounts future cash flows back to their present-day value so you can compare projects with different timelines on equal terms.
NPV = Σ (Benefits – Costs) ÷ (1 + r)^t
In this formula, r is the discount rate, and t is the time period. A positive NPV means the project is expected to generate more value than it costs when you account for the time value of money. A negative NPV suggests the costs outweigh the benefits over time.
Return on investment
Return on investment (ROI) measures the percentage return on the investment relative to its cost. It's a quick way to communicate value to stakeholders who want to know what they're getting back:
ROI = (Net benefits ÷ Total costs) × 100
For example, if your net benefits (total benefits minus total costs) are $50,000 and total costs are $100,000, your ROI is 50%. This makes it easy to compare projects of different sizes or scopes on the same scale.
Payback period
The payback period tells you how long it takes for a project's benefits to recover the initial investment:
Payback period = Total investment ÷ Annual net benefits
A shorter payback period means you recover your investment faster and face less risk. This formula is especially helpful when your team needs to show leaders how quickly an investment will pay off.
Cost-benefit analysis example
Here's how these formulas work together: imagine your marketing team is deciding whether to invest in a new project management tool to replace a manual, spreadsheet-based workflow.
Step 1: Define the decision. The team wants to determine whether adopting a project management platform will save enough time and reduce enough errors to justify the cost.
Step 2: Identify all costs.
Annual software license: $12,000
Implementation and setup: $3,000 (one-time)
Team training: $2,000 (one-time)
Ongoing maintenance and admin: $1,000/year
Total first-year costs: $18,000
Step 3: Identify all benefits.
Time saved on status updates and reporting: $10,000/year (based on hours recovered)
Fewer missed deadlines, reducing rework: $8,000/year
Improved visibility leading to better resource allocation: $5,000/year
Reduced errors from manual data entry: $2,000/year
Total first-year benefits: $25,000
Step 4: Apply formulas.
BCR: $25,000 ÷ $18,000 = 1.39 (benefits outweigh costs)
Net benefit: $25,000 – $18,000 = $7,000
ROI: ($7,000 ÷ $18,000) × 100 = 38.9%
Payback period: $18,000 ÷ $25,000 = 0.72 years (about 8.6 months)
Step 5: Make your recommendation. The data support moving forward with the investment. Document these figures, note your assumptions, and present the findings to stakeholders:
BCR of 1.39: Benefits outweigh costs.
ROI of 38.9%: Strong percentage return on the investment.
Payback period of ~8.6 months: The team recovers its investment in under a year.
Common mistakes to avoid in cost-benefit analysis
Even a well-organized CBA can lead to bad decisions if the information you use is wrong. Here are some common mistakes teams make and how to avoid them.
Overlooking hidden costs. It's easy to account for obvious expenses like software licenses or salaries, but teams often miss indirect costs such as onboarding time, productivity dips during transitions, or ongoing maintenance. Review your cost list with colleagues from different functions to catch what you might miss on your own.
Ignoring intangible benefits. Benefits like improved morale, stronger brand reputation, or better team collaboration are real, but they're harder to quantify. Don't leave them out entirely. Instead, estimate their value based on related metrics, such as reduced turnover or faster hiring.
Using an incorrect discount rate. The discount rate you choose for NPV calculations significantly changes the outcome. A rate that's too low can make a weak project look promising, while a rate that's too high can kill a good one. Use your organization's standard discount rate, or consult your finance team for guidance.
Underestimating the timeline. Projects almost always take longer than expected. If your CBA assumes a six-month rollout but implementation takes 12, your costs increase, and your benefits are delayed. Build in realistic buffers.
Skipping stakeholder input. A CBA built in isolation often misses important perspectives. Involve people from finance, operations, and the teams who will be directly affected. Their input improves accuracy and increases buy-in when it's time to make a decision.
Forgetting to document assumptions. Every CBA relies on estimates and projections. If you don't write down what you assumed, and why, the analysis loses credibility over time. Clear documentation makes it easier to revisit and update the analysis when conditions change.
Track your cost-benefit analysis in Asana
Doing a cost-benefit analysis is just one step. You also need a way to keep track of your costs, benefits, and assumptions as the project goes on. Asana lets your team manage the analysis and the related work in one place, so nothing gets missed.
Integrated analysis features
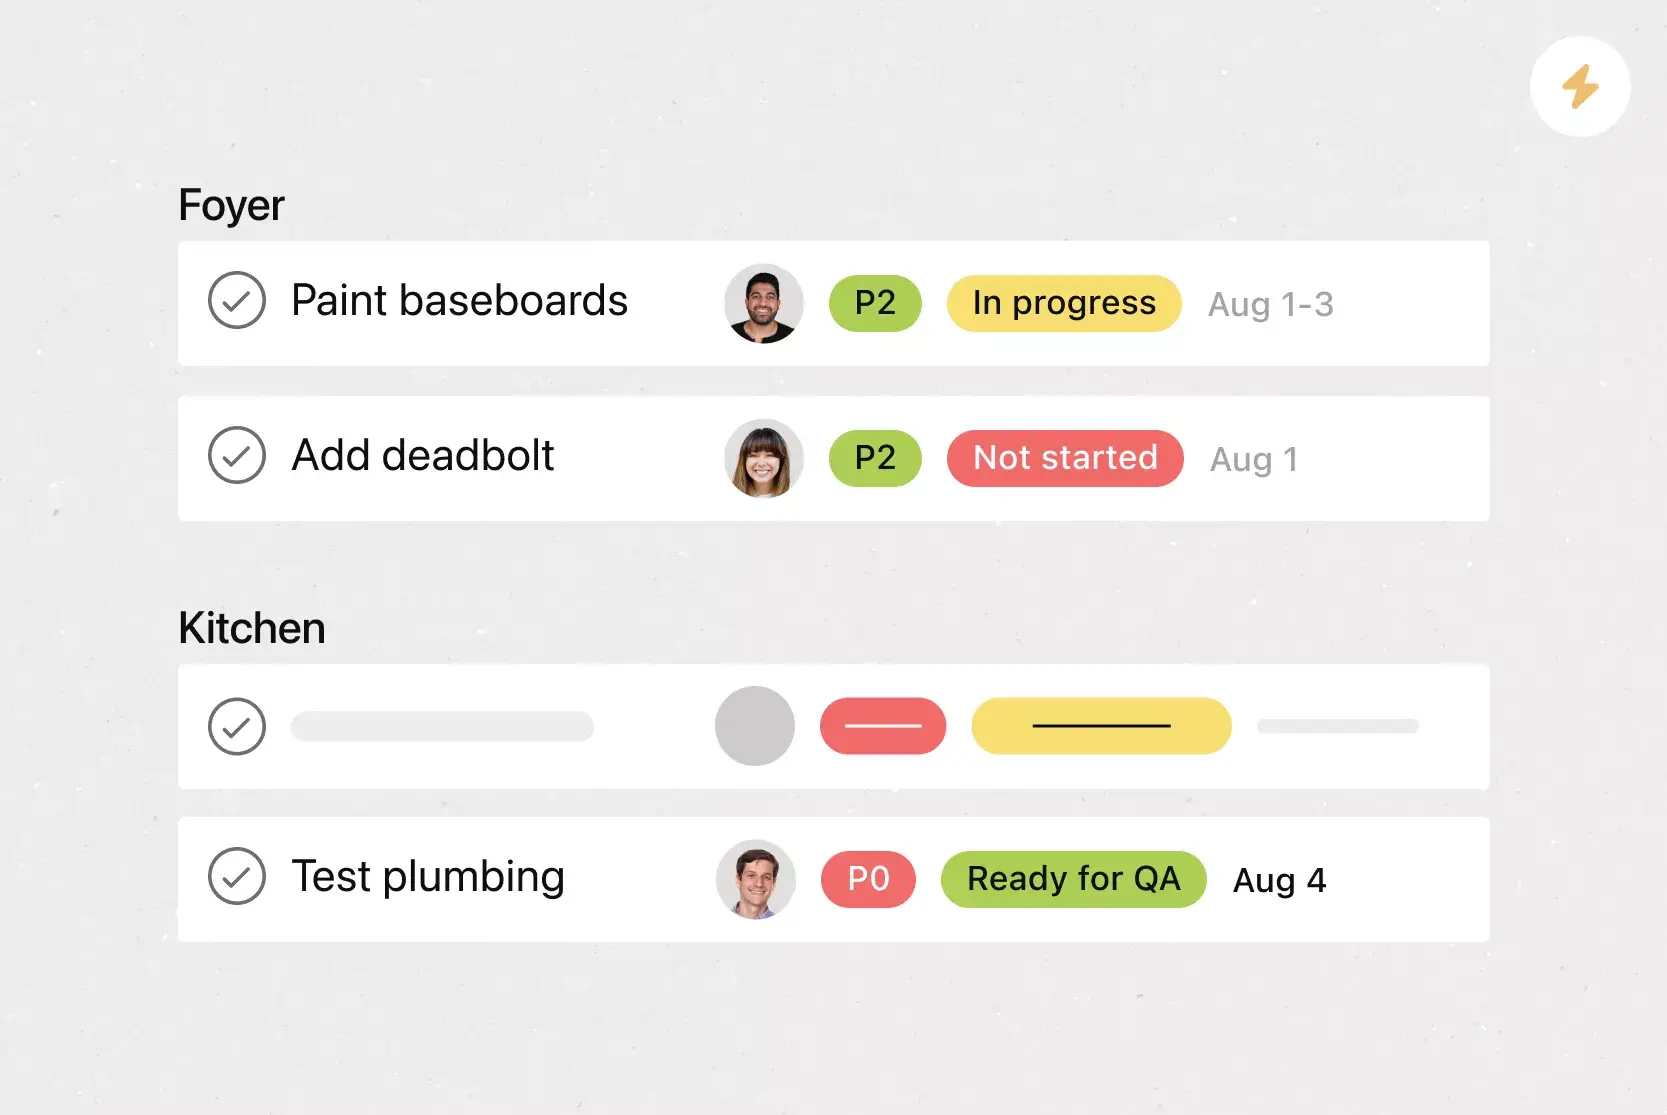
List View shows tasks, due dates, milestones, and custom fields in a grid, allowing teams to scan their workflows in real time. It helps everyone see ownership and timing without switching between views.
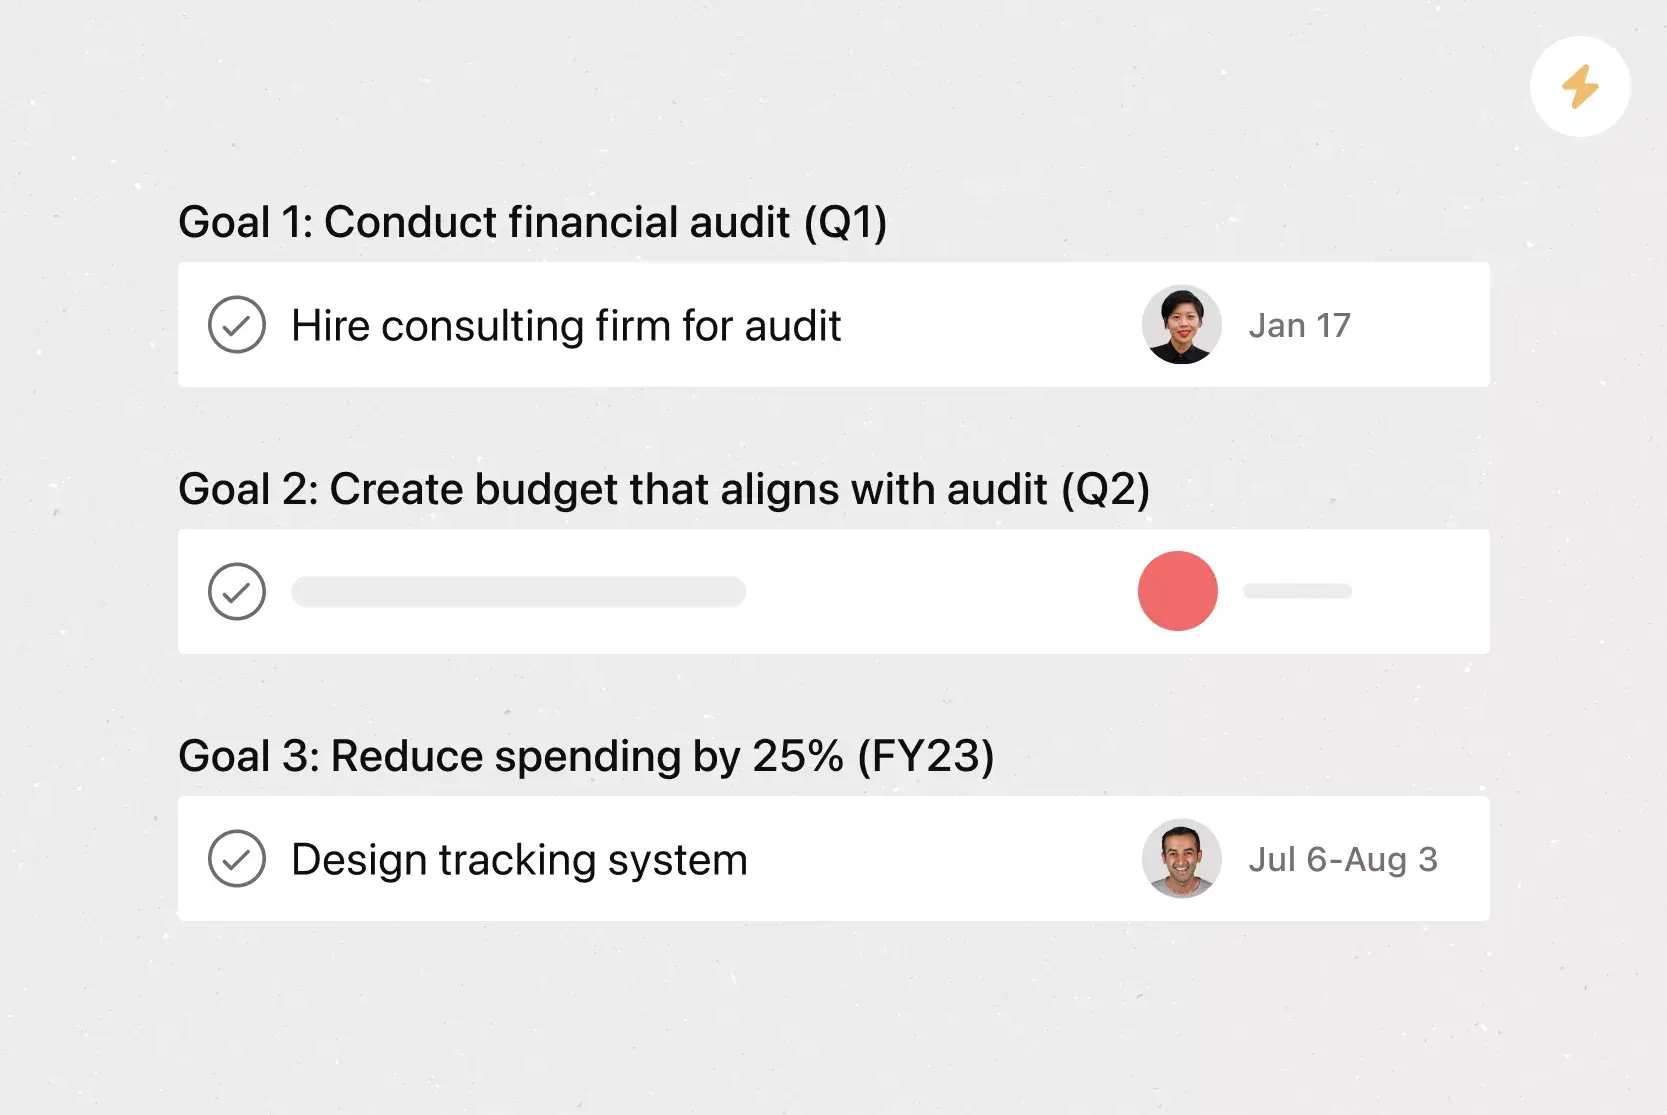
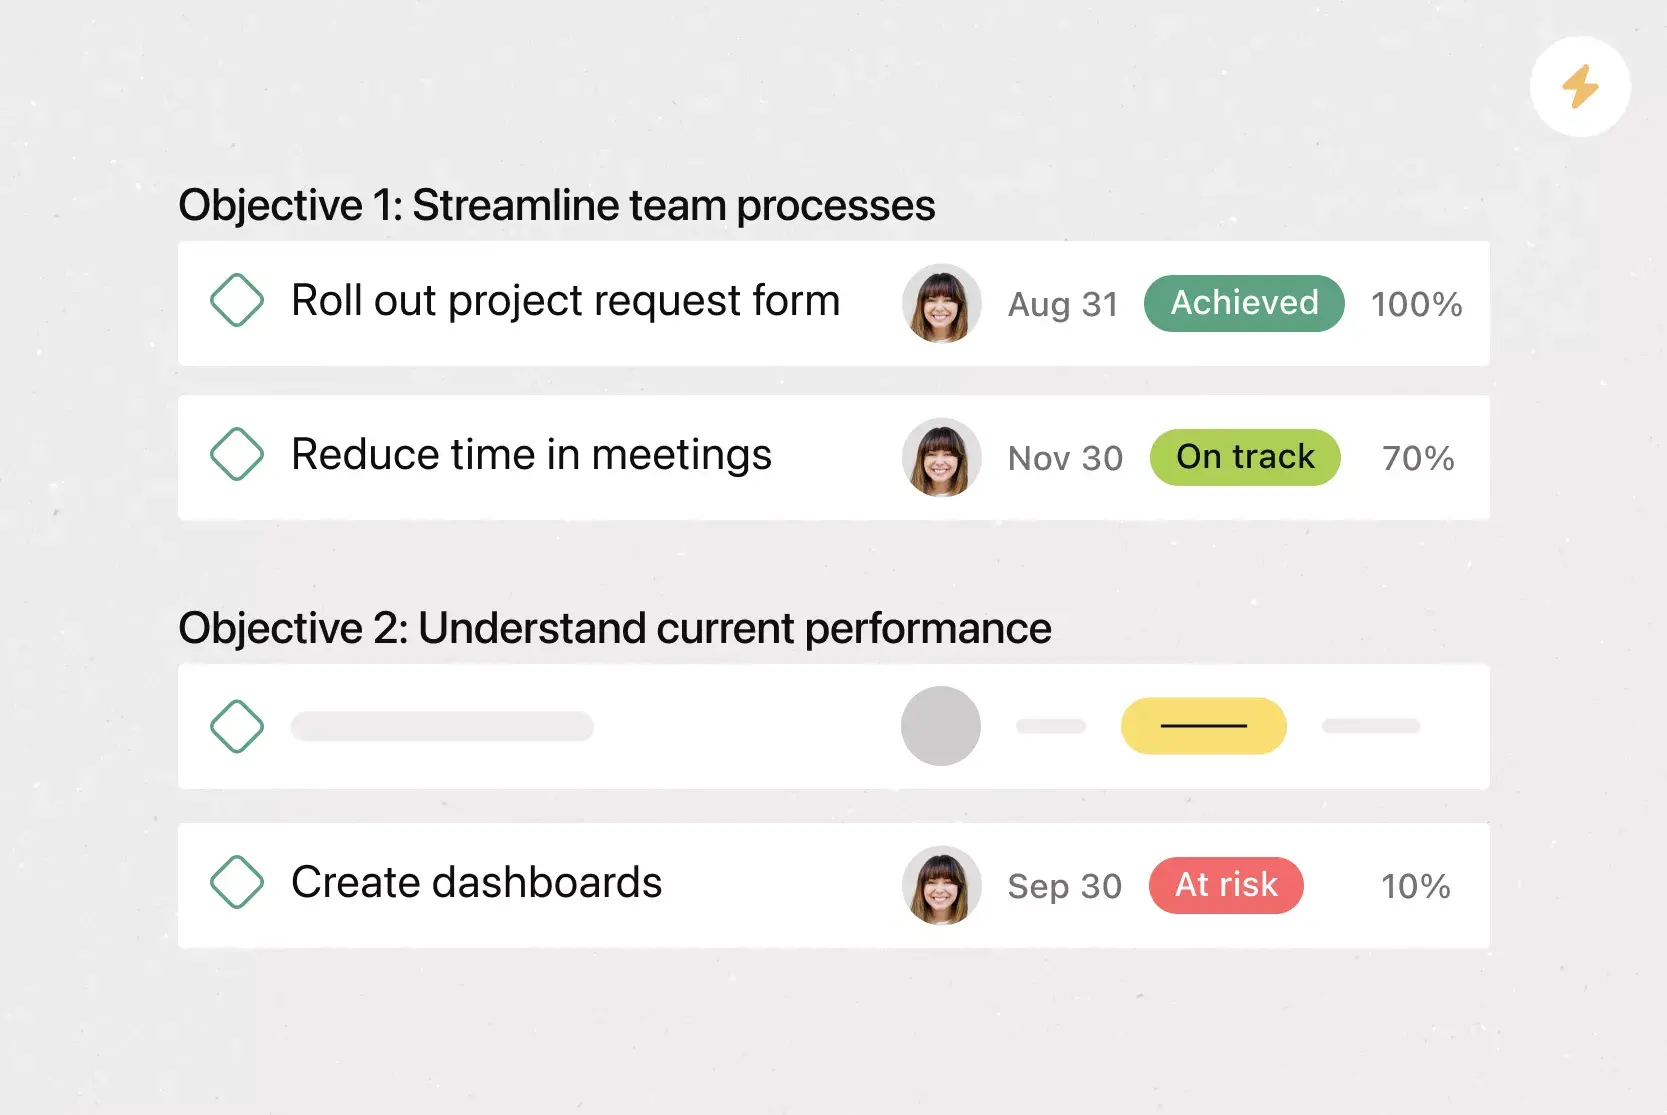
Goals connect high-level objectives directly to the work behind them. This connection helps teams see priorities and adjust effort as plans change.
Automation handles routine tasks such as assigning tasks, updating due dates, and notifying stakeholders. Teams use rules to reduce manual steps and keep work moving.
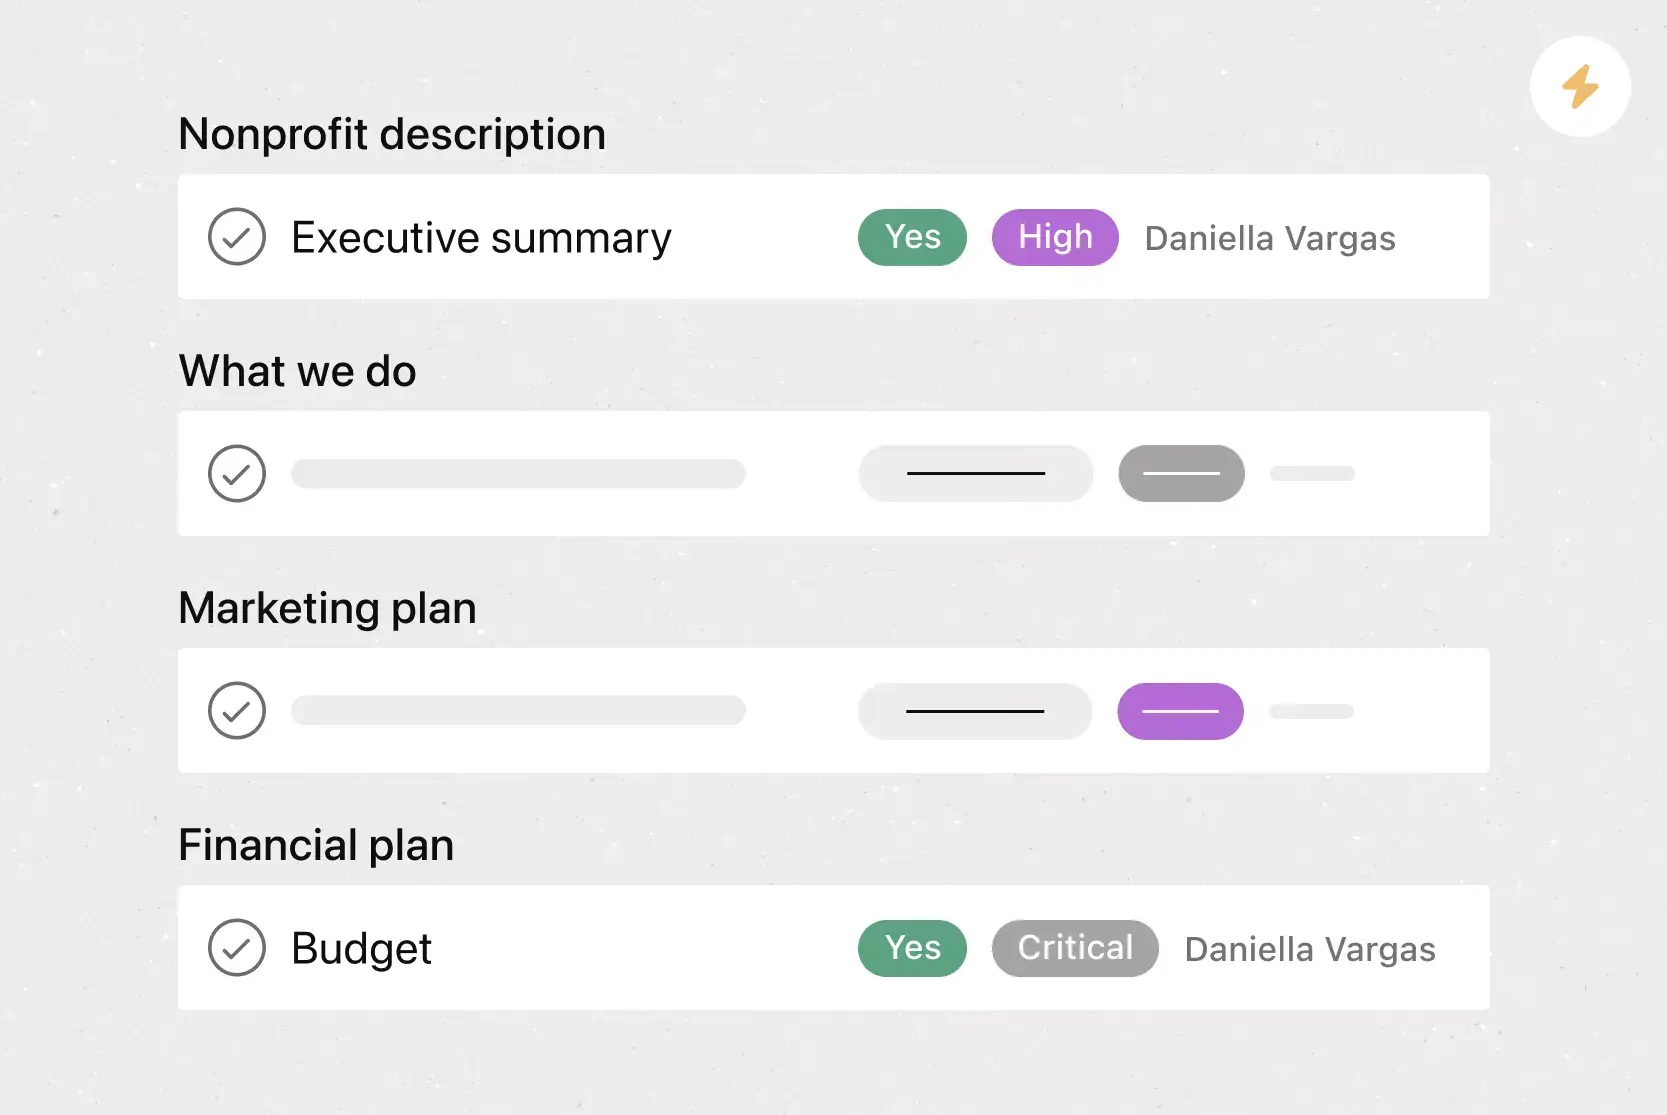
Custom fields let teams tag, sort, and filter work by details like priority, status, or contact information. This customization makes it easier to organize tasks and focus on what matters next.
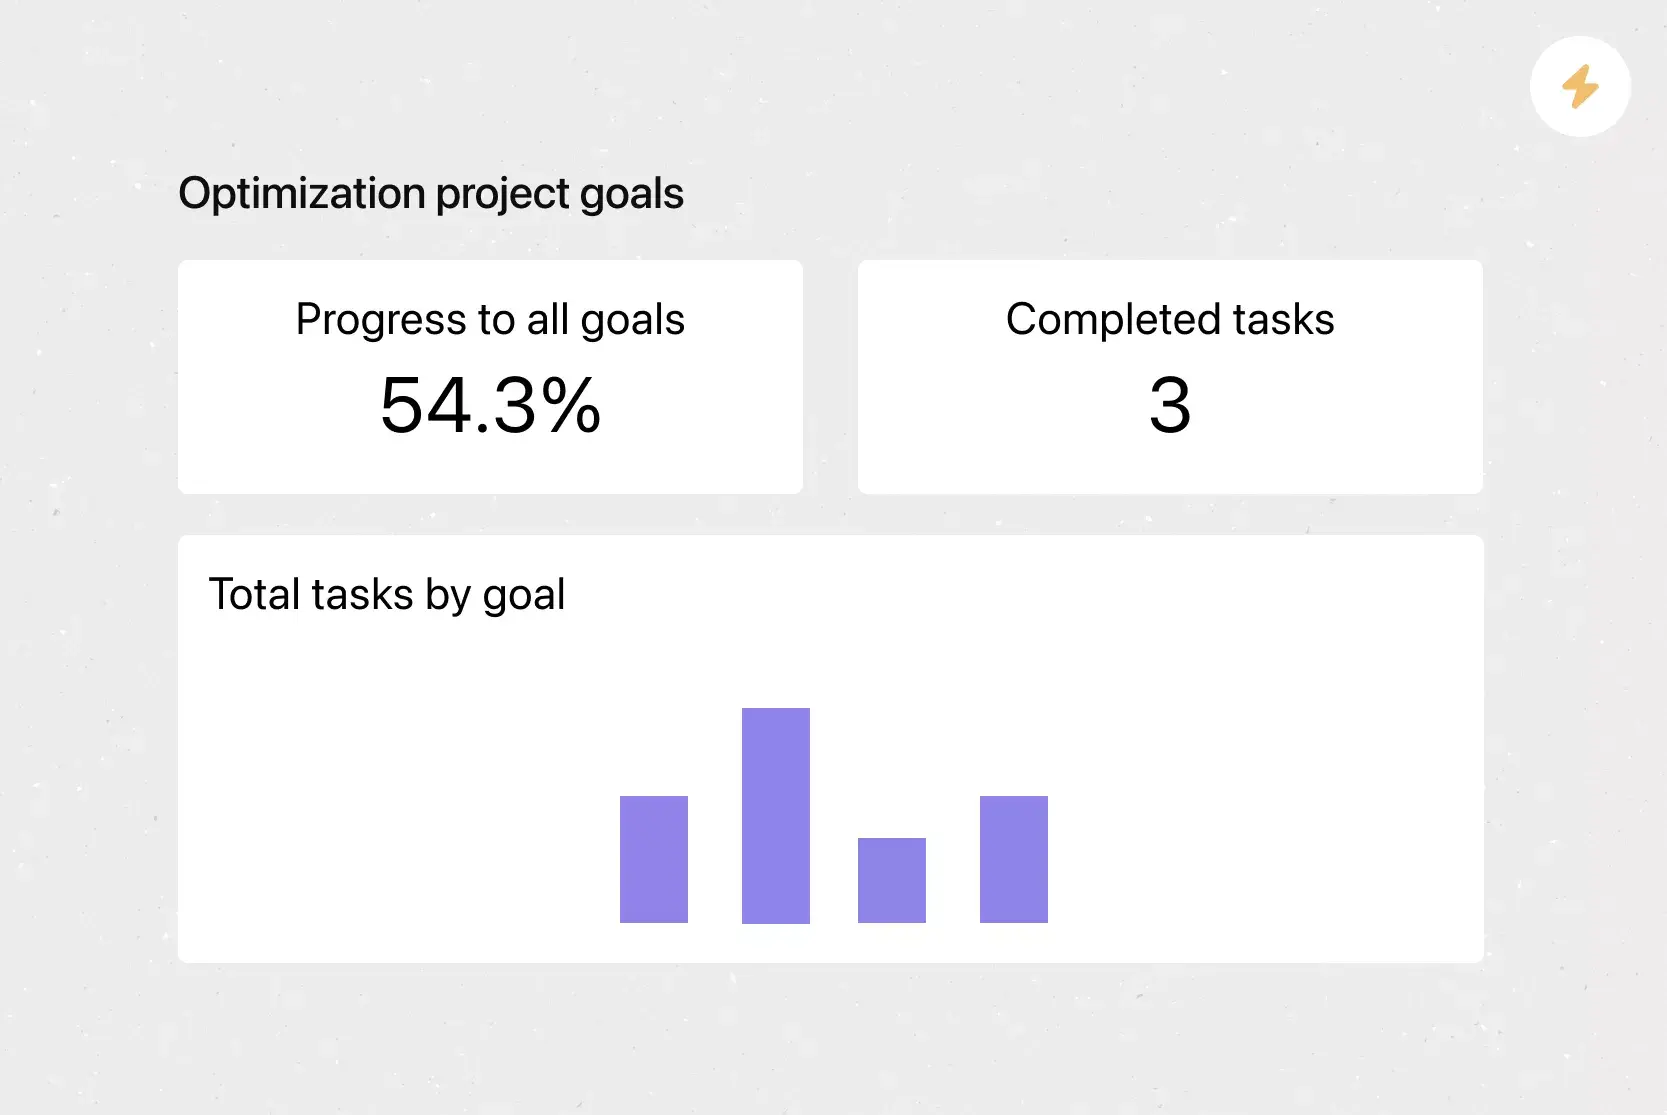
Reporting dashboards provide teams with a visualroadmapof progress, blockers, and keymetrics, so managers can review work and spot issues without having to pull separate reports.
Recommended apps
Microsoft Teams integrates with Asana, enabling teams to convert conversations into Asana tasks and manage follow-ups during meetings. Teams can create, assign, and review work without leaving Teams.
Salesforce connects sales and service work to Asana so teams track requests, share files, and coordinate handoffs. This setup helps teams respond faster and avoid dropped requests.
Slack messages turn into tasks with owners and due dates, so ideas and requests don't get lost. Teams capture work directly from chat and track progress in Asana.
Google Workplace lets teams attach Drive files to tasks and collaborate on documents from one place. Teams access files quickly without jumping between tools.
Put your cost-benefit analysis into action
A cost-benefit analysis template helps you make confident, data-driven decisions before committing resources. By defining costs, quantifying benefits, and applying the right formulas, you give your team and stakeholders a clear picture of what each option requires and delivers. With Asana, you can run your entire analysis in one place, track assumptions as they evolve, and connect every decision to the work that follows. Get started and move from analysis to action.
Frequently asked questions about cost-benefit analysis
What are the 5 steps of cost-benefit analysis?
What is cost-benefit analysis, and how does it work?
When should you use a cost-benefit analysis template?
Do I need a cost benefit analysis template?
What is the difference between a risk analysis and a cost benefit analysis?
Related templates


![[Templates] Product Roadmap (Card image)](https://assets.asana.biz/transform/2728edf4-eb35-4dd5-8d03-25ba8cbe5864/TG23-web-thumbnail-028-scrumban-feature-static-2x?io=transform:fill,width:2560&format=webp)


Create templates with Asana
Learn how to create a customizable template in Asana. Get started today.