Asana acquires StackAI — now every human-agent workflow runs in one place.Learn more
Process flow: definition, diagrams, and examples for teams


85% of Fortune 100 companies choose Asana¹


Summary
Are you looking for a way to improve how your team gets work done? Revisiting your process flow may be the solution.
A process flow is a series of steps your team follows to achieve your goal. Visualizing your process flows can help you uncover redundancies, repetitive tasks, and bottlenecks.
You can visualize process flows using timelines or workflow diagrams. In this article, you'll learn what process flows are, how they differ from flowcharts, and how to use them to improve your team's efficiency.
From Planning to Gold: NCAA's Campaign Success
Discover how NCAA leveraged Asana to scale their Olympic campaign and achieve unprecedented ROI. Join our webinar to learn their proven strategies and see how AI-powered workflows can help your team deliver winning campaigns.
What is process flow?
A process flow is the sequence of steps your team completes to achieve a specific goal. Visualizing this sequence in a diagram or flowchart helps everyone understand task order and dependencies at a glance.
Improving processes is critical for getting higher-impact work done faster. Knowledge workers miss over 25% of their deadlines each week, and unclear processes are a top contributing factor. By clarifying who's doing what by when, you empower your team to complete work more effectively.
Process flow example
Regardless of your job description, there's one simple process flow that everyone is familiar with: requesting time off. This process is pretty linear and a great example of how you can visualize a subsequent order of tasks:
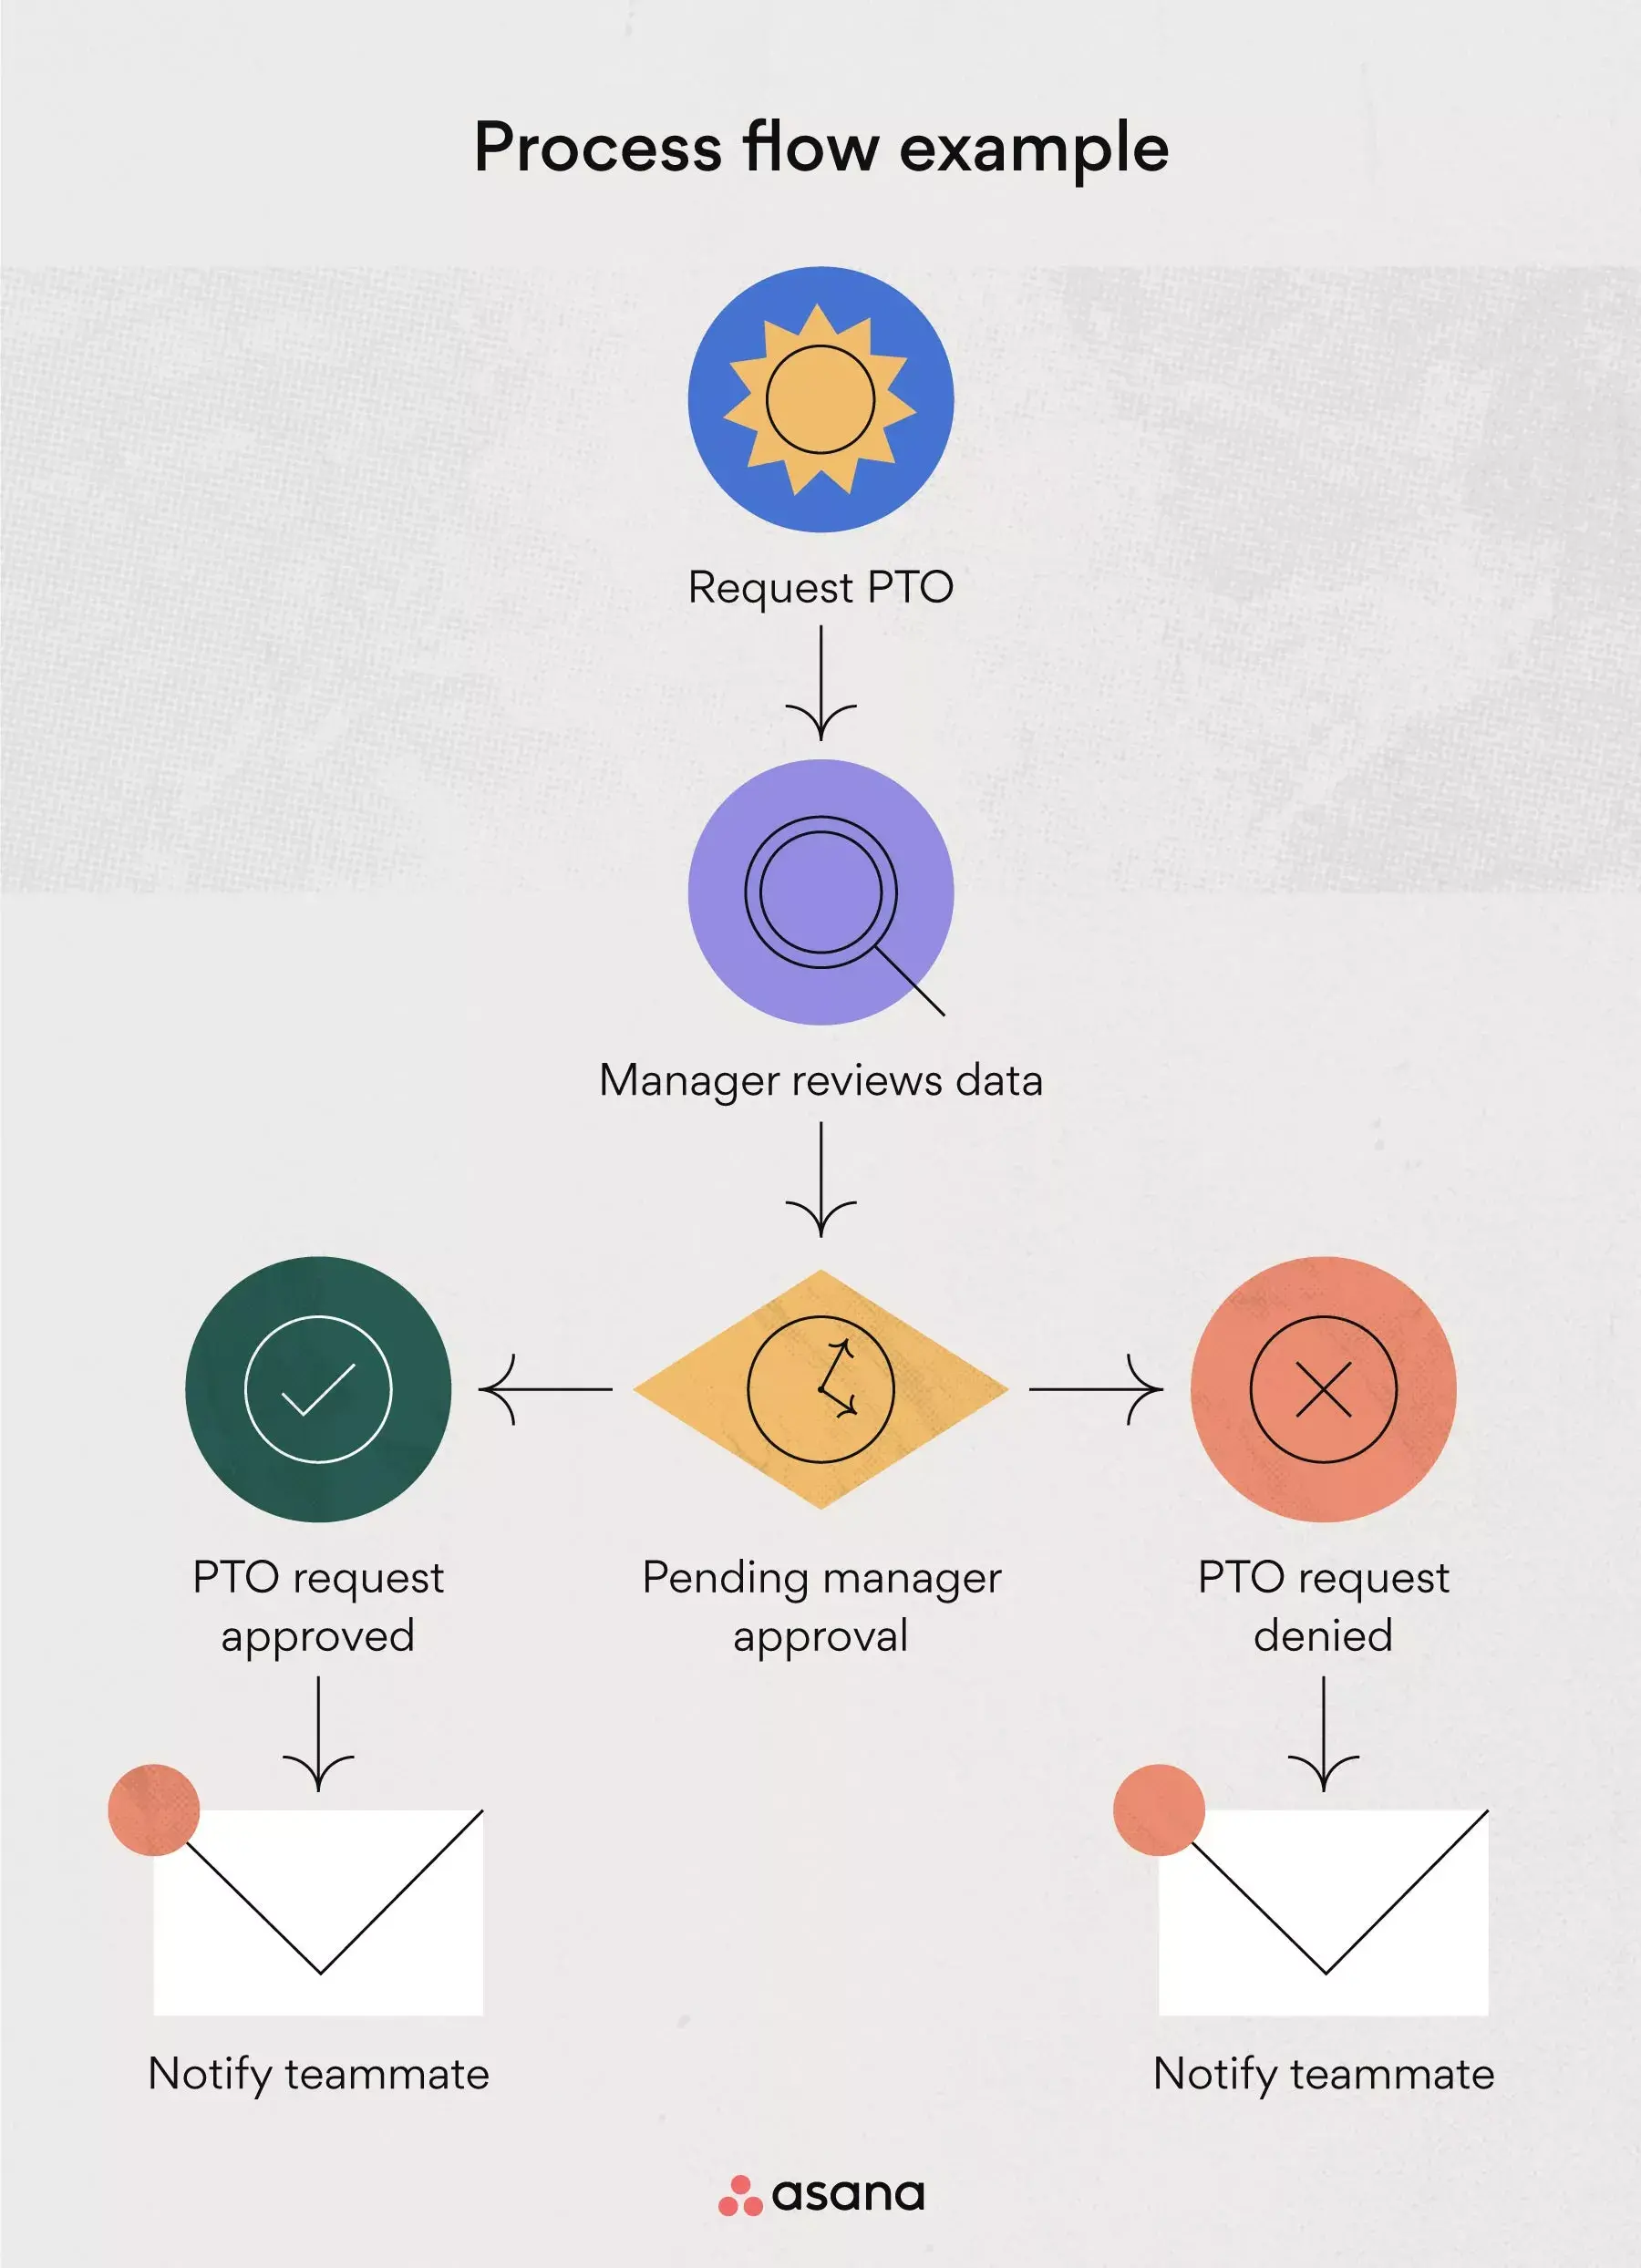
Step 1: Request your paid time off (PTO).
Step 2: Your manager reviews your request.
Step 3: Your manager decides whether to approve your request.
Step 4: You'll receive an email about your manager's decision.
Step 5: Your request is either approved or denied.
Ideally, process flows like the one above are accessible to everyone. That way, your team knows where to find process flows for all kinds of workflows and can reference them when working on new or unfamiliar processes.
Process flow vs. flowchart
While these terms are often used interchangeably, they serve different purposes. A process flow is the actual sequence of steps your team follows; a flowchart is the visual diagram that represents it.
Process flow | Flowchart |
The sequence of tasks to reach a goal | A visual diagram of that sequence |
Describes what happens | Shows how it happens |
Conceptual approach | Uses standardized symbols and connectors |
You may also hear process flows called by other names:
Process map
Process flow diagram (PFD)
Business process flow
Workflow diagram
Business Process Modeling and Notation (BPMN)
Regardless of the name, the goal is the same: create clarity around how work gets done so your team can move forward with confidence.
What is a process flow diagram (PFD)?
A process flow diagram is one way to visualize your process. Depending on the type of process flow you're depicting, you may call them top-down flowcharts, schematic flow diagrams, value stream maps, or process flowcharts.
The process flow diagram (PFD) was first introduced by Frank Gilbreth, Sr., an industrial engineer and efficiency expert. The American Society of Mechanical Engineers (ASME) adopted the concept in the 1920s.
Today, process flows are still used in chemical and process engineering but are also popular tools in manufacturing and business (where they're often called business process flow, or BPF).
Types of process flow diagrams
Depending on what you're trying to communicate, you can choose from several diagram types:
Basic flowchart: A simple, linear diagram showing steps in sequence, best for straightforward processes.
Swimlane diagram: Divides the process into lanes by person, team, or department, ideal for showing handoffs.
Data flow diagram: Focuses on how data moves through a system, useful for IT and systems planning.
BPMN diagram: A standardized notation for detailed business process modeling in complex enterprise workflows.
Choose the type that best fits your process complexity and audience.
Common process flow symbols
The International Organization for Standardization (ISO) established the most widely used PFD symbols. Using standardized symbols ensures everyone can read your flowchart without additional explanation.
Symbol | Shape | Meaning |
Terminator | Oval | Start or end of a process |
Process | Rectangle | A task or action step |
Decision | Diamond | A branching point with multiple paths |
Flow line | Arrow | Direction of flow between steps |
Data | Parallelogram | Input or output (data, materials) |
If you're curious about the different types of flowcharts and kinds of symbols, read our article on flowchart types, symbols, and how to read them.
Create a process map template
What is a process flow used for?
Process flows are more than handy charts. They're an incredibly helpful tool in project management that you can use to analyze, optimize, and standardize new and everyday processes.
Here are four ways in which process flows can positively affect how you run your business:
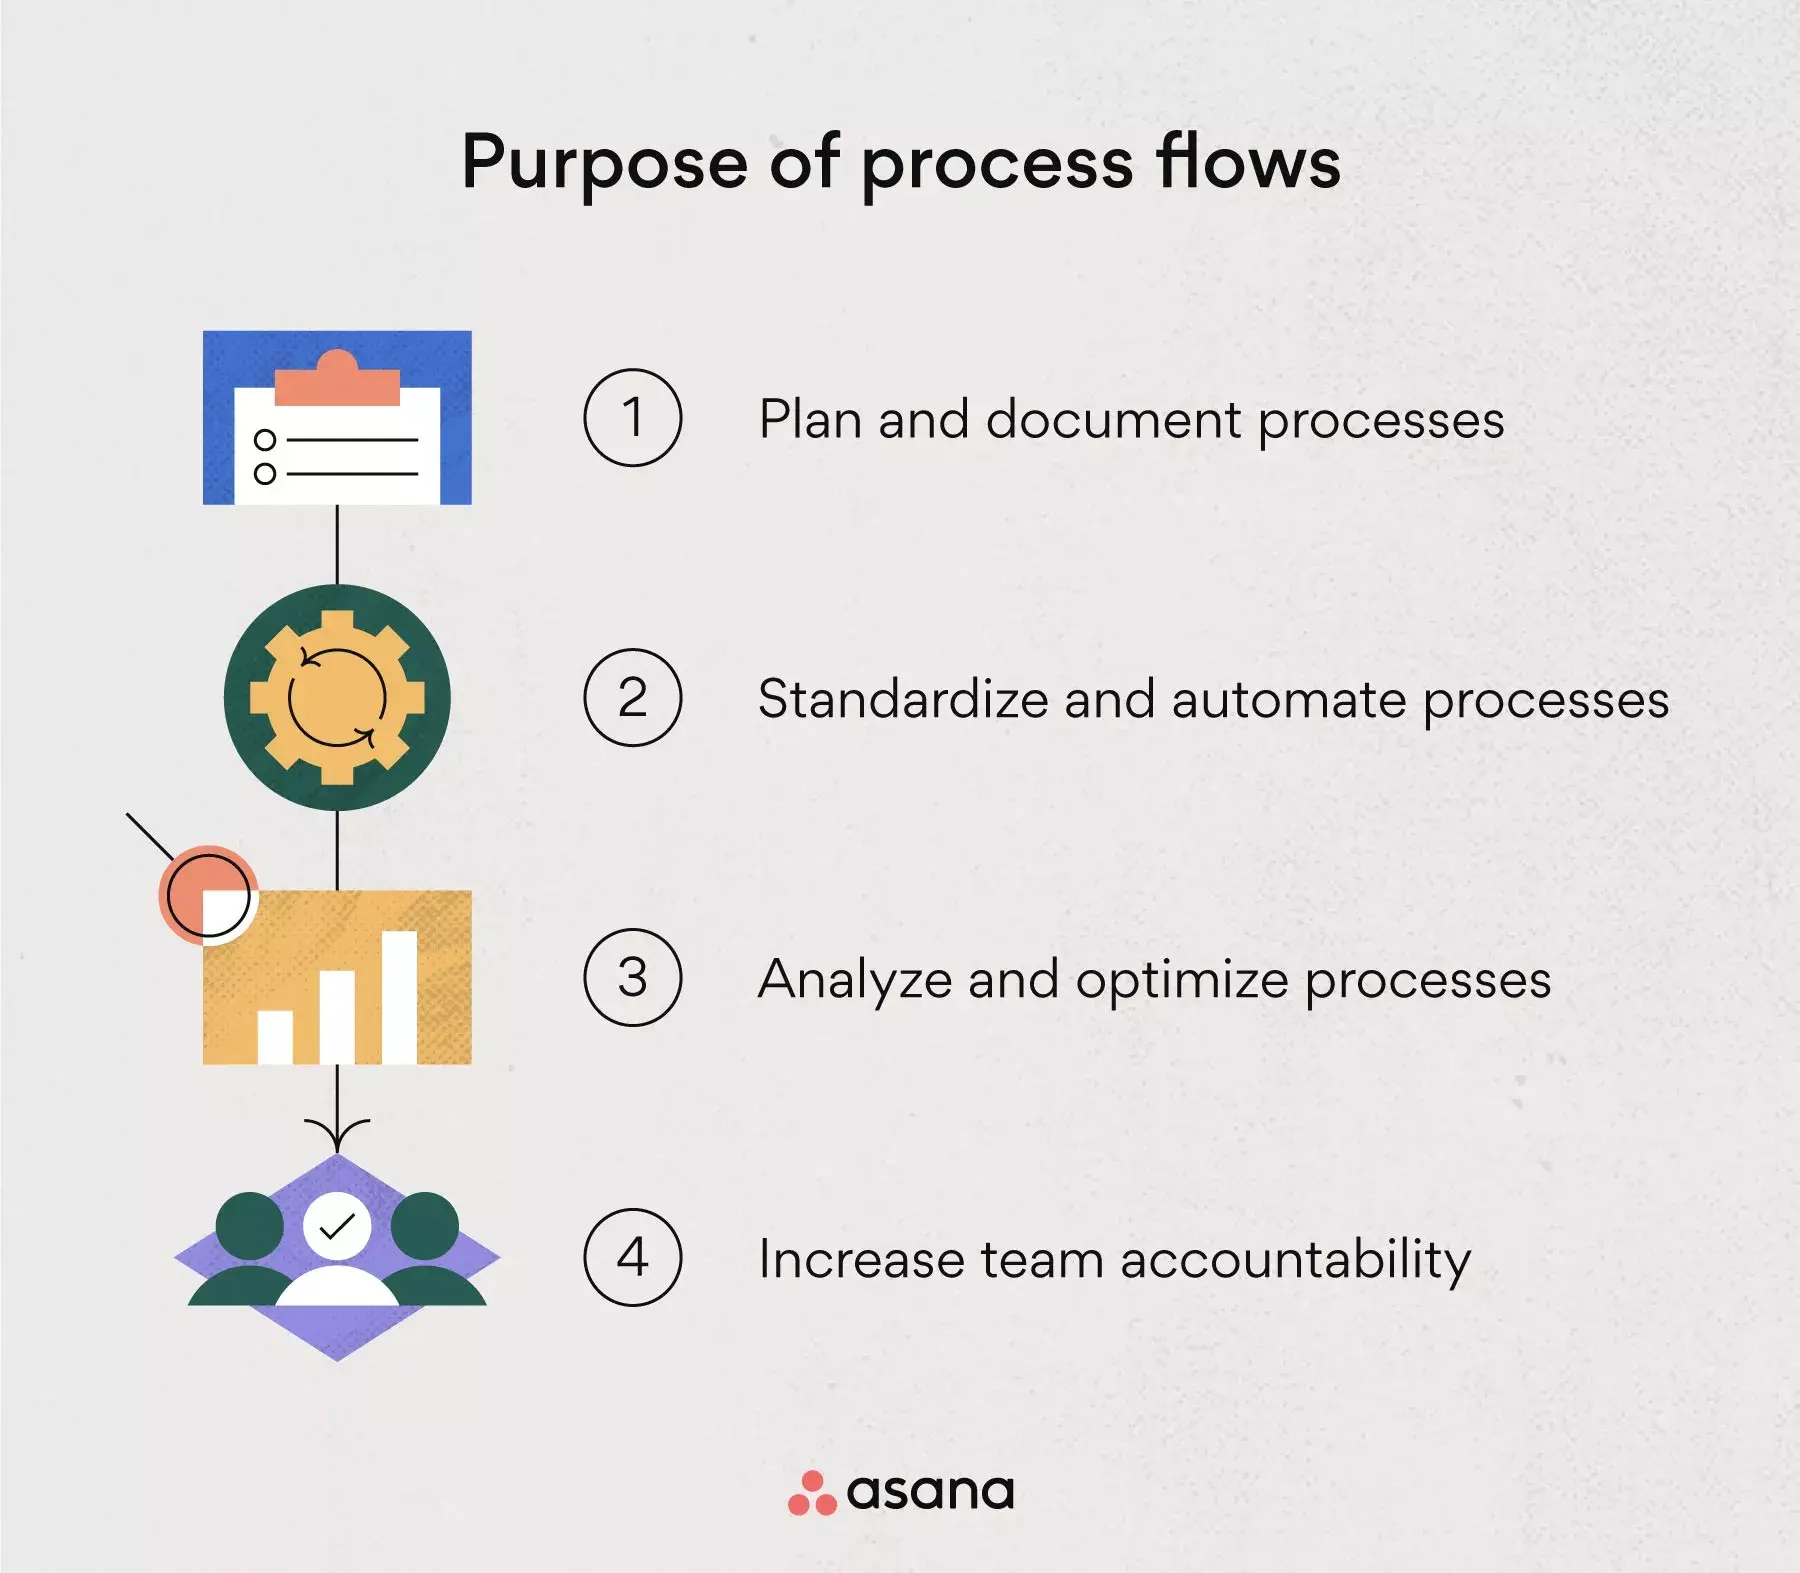
Plan and document processes
Unclear processes lead to disengaged team members, low morale, and tasks that fall through the cracks. Mapping your process gives your team a central source of truth to reference when questions arise about next steps or ownership.
For example: Rather than having your team track their progress in different places, map out your process in one central location. Use a work management software to streamline your team's tasks and progress.
Standardize processes
Process flowcharts are a great tool for standardizing or streamlining processes. Instead of reinventing the wheel every time you start a new project, your team can reference a standardized diagram and stick to it. This prevents missed tasks and unnecessary risks.
For example: Like the PTO request example earlier, creating a diagram or flowchart that explains a standardized process will make it a lot easier for your team to understand what's happening. When they see the big picture, they'll likely feel more valued and less stressed out about the process.
Analyze processes for optimization
When mapping your process flow, you may realize there are redundancies or repetitive tasks you can omit. You may also uncover process risks to communicate to your team so they're aware of them. This will improve both the efficiency and effectiveness of your processes.
For example: Let's say upon reviewing a new process flow, a stakeholder notices that you could skip a step in the communication process. You may be able to shave valuable time off your timeline by omitting this step and optimizing your process flow.
Workflow management software can also help your team put the updated process into practice by assigning owners, setting deadlines, and automating repeatable steps.
Increase your team's accountability
When everyone on your team knows exactly what their tasks are and when they're due, your process can flow without disturbances. A good process flow diagram also gives team members a clear view of any important project dependencies, resource constraints, or due dates they need to account for.
For example: If you're creating an article for your blog without a process flow, you may find that you're running into roadblocks. Perhaps your team is unable to get work done on time, or they often experience miscommunication issues. If you clearly define and visualize the process, everyone knows when it's their turn and who to contact if assets are missing.
Process flowcharts are typically used to map out simple processes.
Create a process map template5 steps to document business process flow
You can create business process flowcharts or workflow diagrams in five simple steps:
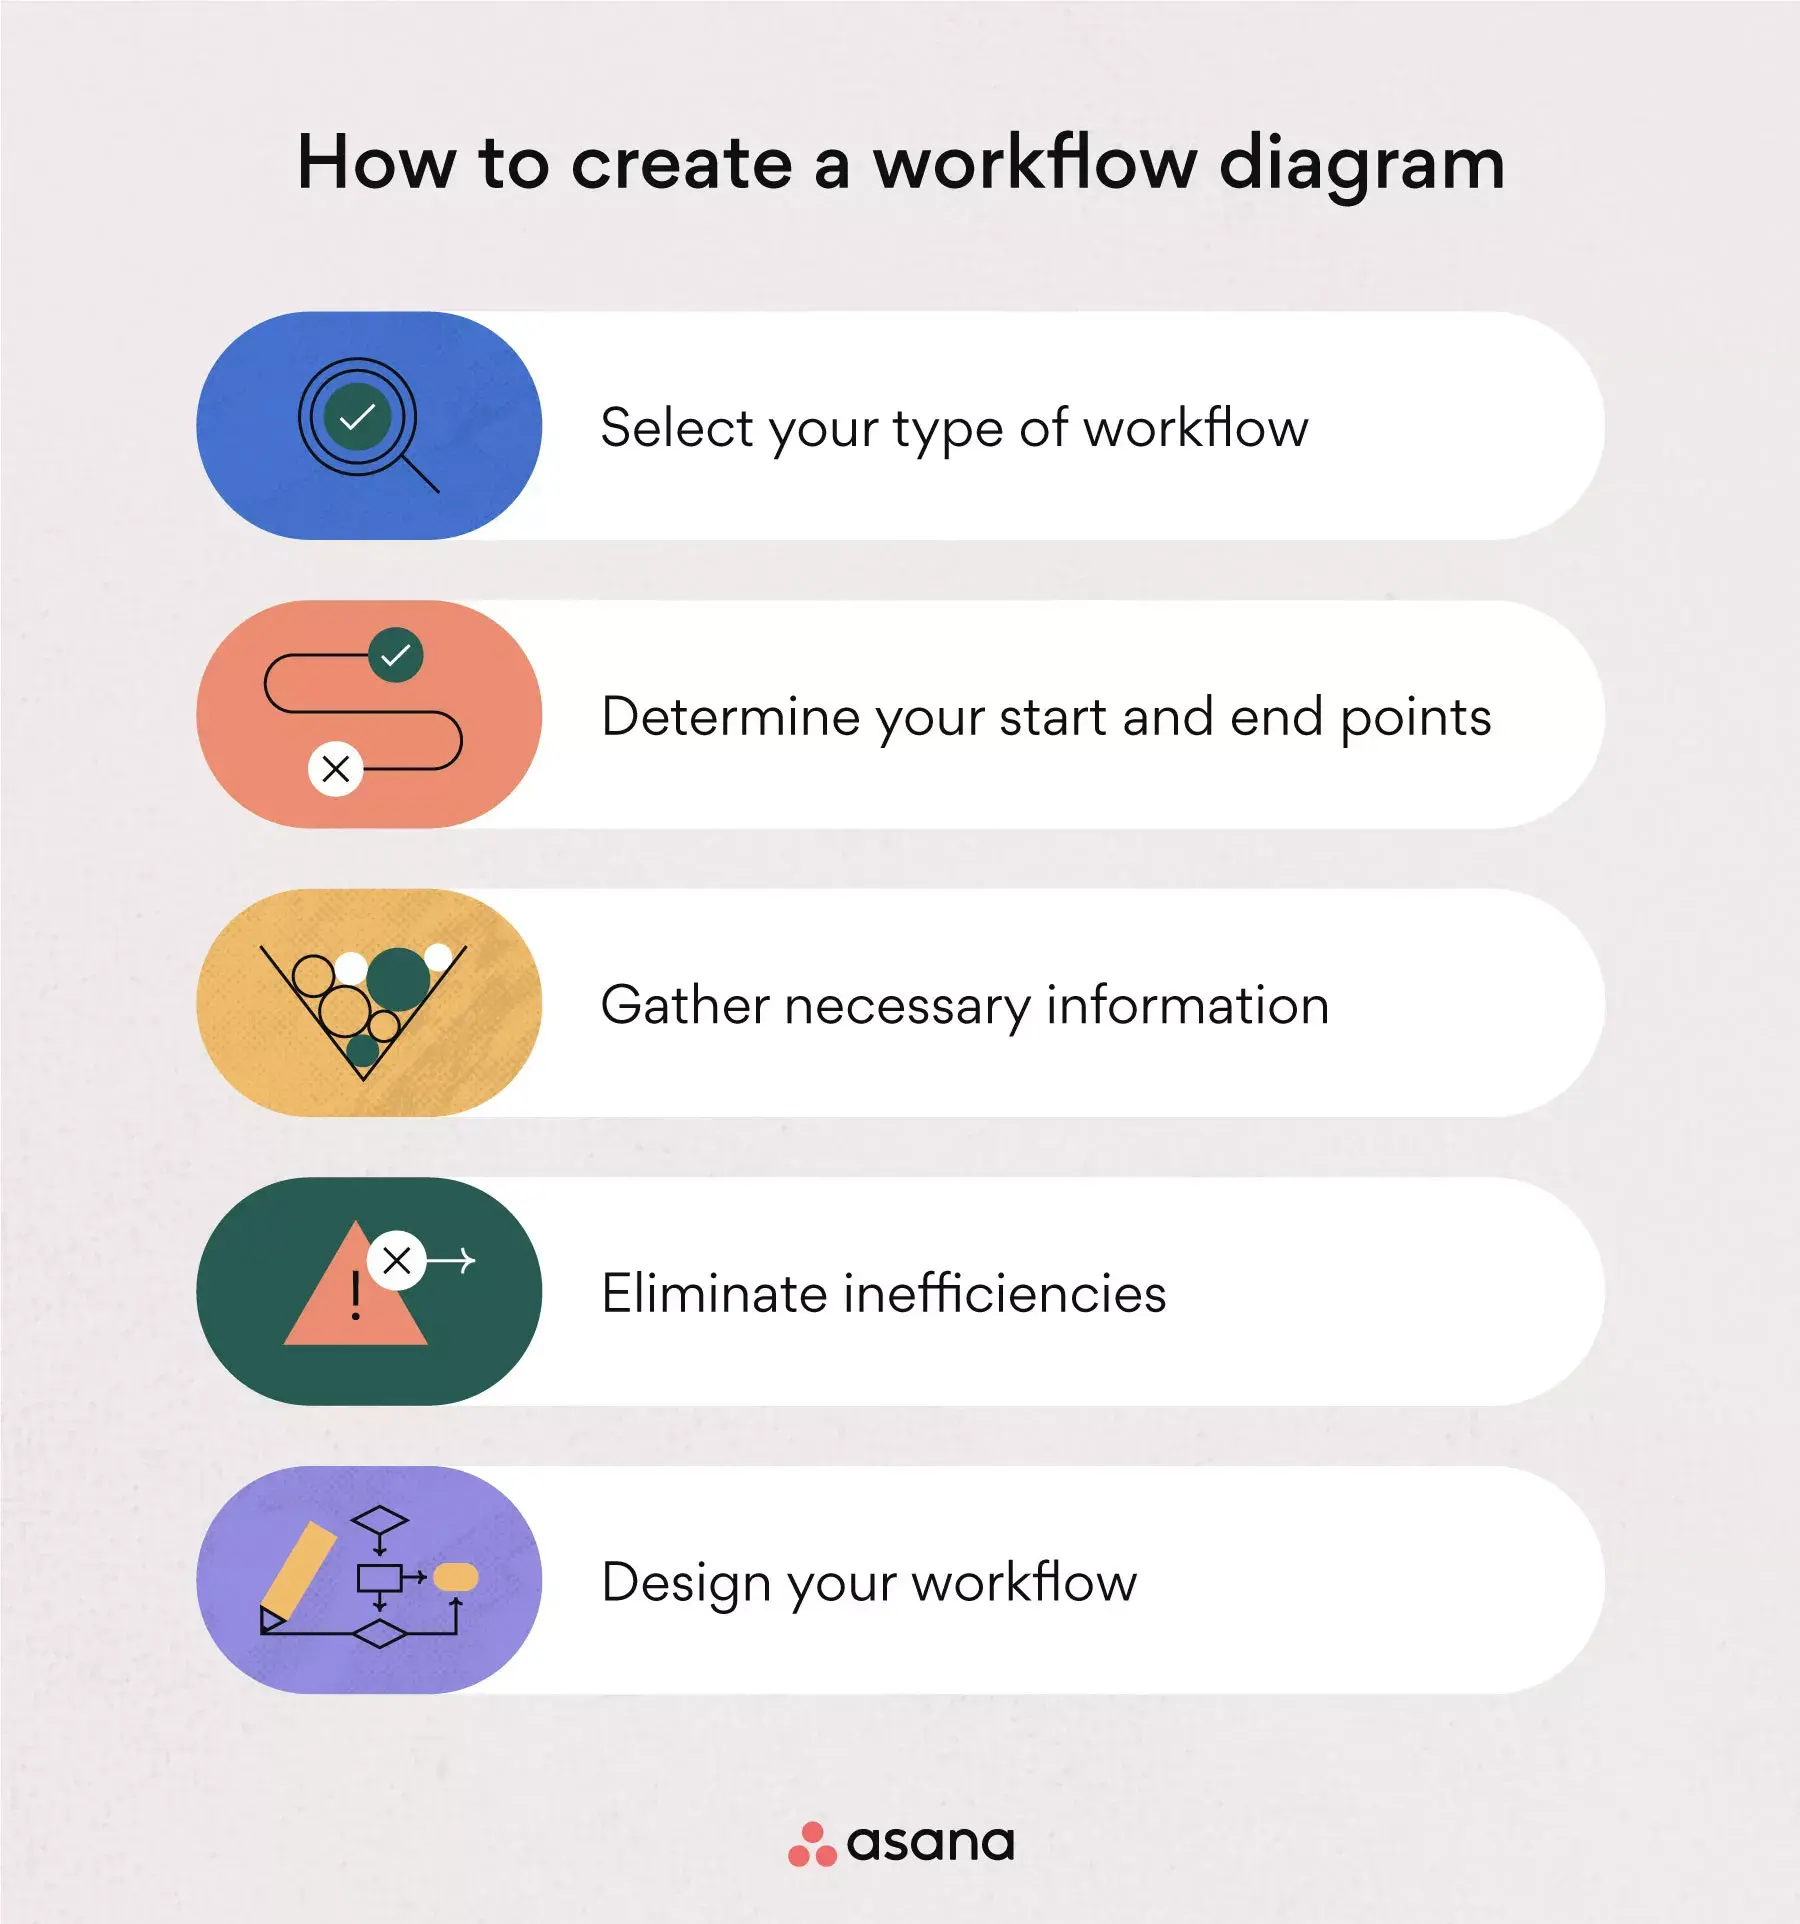
Step 1: Select your type of diagram. Depending on the complexity of your process, you can create a simple process flow diagram or choose a more complex visualization, such as a swimlane diagram.
Step 2: Determine your start and end points. Indicate which actions trigger the start and end of your process so you can effectively communicate these stages to teammates or stakeholders.
Step 3: Gather necessary information. Connect with your team and stakeholders to gather details and approvals needed to create your diagram. Find out which outputs are associated with each step so you can scope the time your team needs to complete their tasks.
Step 4: Eliminate inefficiencies. Analyze your diagram to uncover any redundancies or repetitive tasks that may slow your team down or cause bottlenecks.
Step 5: Design your diagram. Now you can design your business process or workflow diagram. Map them out in the diagram type you chose in step one, then review it with your team and stakeholders to ensure everything is accurate.
Optimize your process flow with Asana
Whether you want to streamline a simple process or a cross-functional, complex one, Asana helps you keep track of what's up next.
Check out our workflow solutions and hit the ground running with templates designed to make your life easier. Ready to bring clarity to your team's processes? Get started and see how Asana can help you visualize and optimize every step.
Create a process map template